Note: The original version of this article was published on 25 June 2019, with the international tax-to-GDP ratio figures based on data from the IMF. After discussions with National Treasury, it was agreed that tax-to-GDP figures from the OECD provide a more relevant picture when South Africa is compared with other countries, as the IMF data do not include social security contributions or provincial taxes. The article was revised on 12 July 2019 to reflect this.
Personal income tax has become more important as a source of government revenue in recent years. Stats SA’s latest publication provides a breakdown of the latest tax data from national government.
Personal income tax contributed over a third of the R1,22 trillion in taxes collected by national government in the 2017/18 fiscal year, according to Stats SA’s Financial statistics of national government report. The second biggest source of tax was value added tax (VAT), followed by company income tax (click on the image to enlarge).

The tax mix looked starkly different a decade ago. In 2008/09, national government collected about the same amount of personal income and company income tax: contributions that year were 31% and 30% respectively.
The 2008–2009 global financial crisis, which resulted in South Africa’s first economic recession since 1994, was particularly hard on businesses. Revenue from company income tax declined in 2009/10, and since then has grown at a much slower rate than the amount collected from personal income tax.

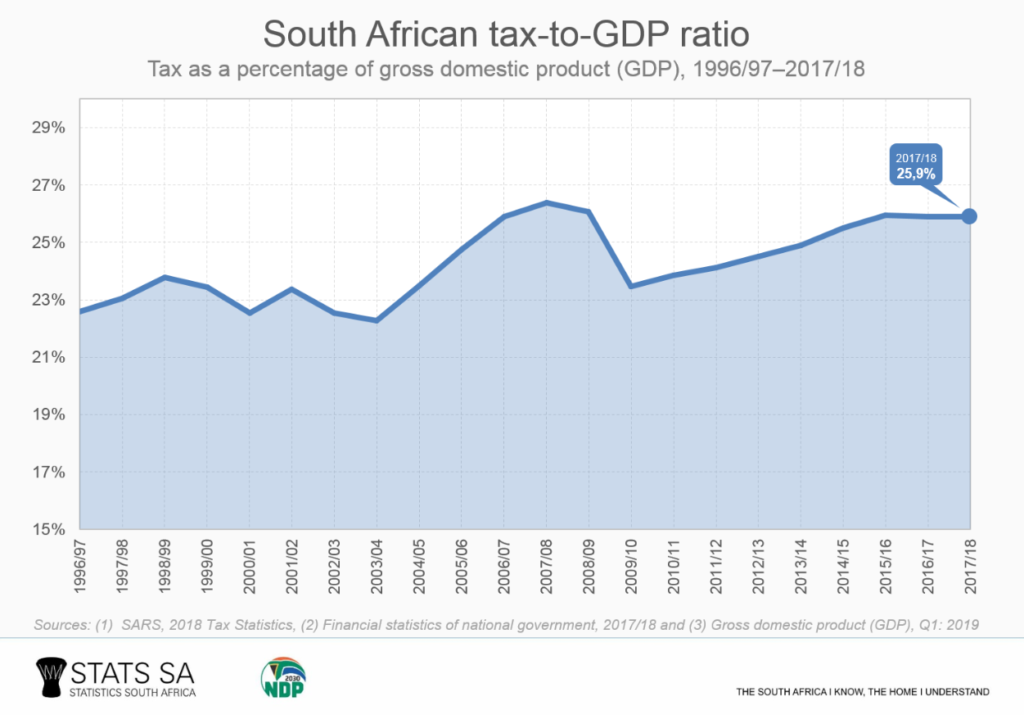
Tax revenue has been increasing despite weak economic growth. The tax-to-GDP ratio, which gives a sense of the tax burden, shows tax revenue as a percentage of gross domestic product (GDP). In 2017/18, South Africa’s tax-to-GDP ratio was 25,9%.1 The chart below shows how the tax-to-GDP ratio has grown since the late nineties, peaking at 26,4% in 2007/08.2 The higher the percentage, the higher the amount of tax collected relative to the size of the economy.

How does South Africa compare with other countries in terms of the tax-to-GDP ratio? Data are available from both the International Monetary Fund (IMF) and the Organisation for Economic Co-operation and Development (OECD). The IMF places South Africa in the top 10 list of countries with the highest tax-to-GDP ratio.3
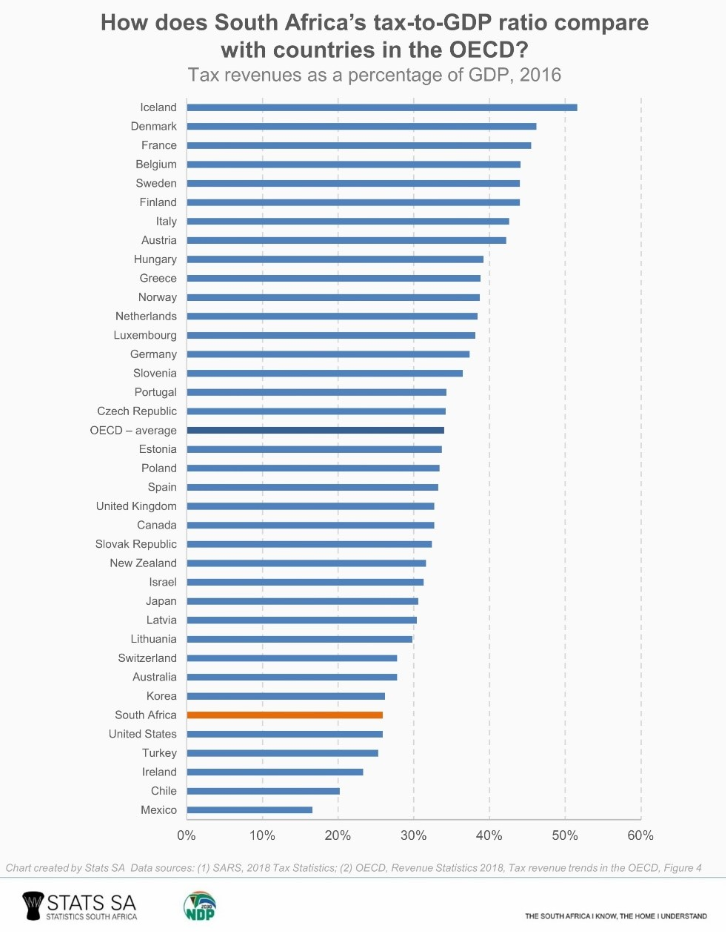
However, it is important to note that the IMF data exclude social security contributions and provincial/state taxes. The OECD data, on the other hand, do include these two items. Since some countries rely more heavily on social security contributions and regional taxes than South Africa, the OECD data provide a more relevant picture for making comparisons.
Compared with the 36 member countries of the OECD, South Africa finds itself at the lower end of the chart below, with a smaller tax-to-GDP ratio than the United Kingdom, Greece and Italy.4

Is having a high tax-to-GDP ratio a good or a bad thing? It depends on each country. For a nation that has a high ratio but where taxpayers are receiving good value for money, a high tax burden might not be that detrimental. Countries such as Denmark, Sweden and Finland have high tax-to-GDP ratios, but these nations report the highest standard of living.
A very low tax-to-GDP ratio can be problematic as it may be a sign of an inefficient tax system. A government will struggle to provide services, build infrastructure or maintain public goods if it fails to collect taxes during periods of strong economic growth. Indonesia, for example, has in recent years committed itself to raise its tax-to-GDP ratio from 10% to 15%.5
The tax-to-GDP ratio alone provides no indication of good governance, the efficiency of the taxation system in the country, nor the way in which taxes are used or distributed.

